

BMI - Body Mass Index
See also: Dieting for Weight LossBody Mass Index (BMI) is a measure that uses height and weight to determine whether someone is a healthy weight. It is by no means perfect, and has particular problems when used with athletes. However, for most people, it will give a reasonable idea of whether you are underweight, a healthy weight, overweight or obese—and this can then be a starting point for further action or conversations.
BMI is widely used by many healthcare professionals around the world to help establish an individual’s risk of illness. It is especially used for diseases and health complaints associated with being overweight or obese, such as heart problems, stroke or cancer. BMI is also used to help establish effective drug doses, because people with a higher BMI may require a higher dose of medicine.
This page explains how to calculate BMI, and provides some simple tools that you can use to calculate and monitor your BMI.
Calculate your BMI
To calculate your Body Mass Index, you need to know your height and weight. Most people know their height—and if you don’t know yours, then ask somebody to measure you. Approximate values within a few centimetres or an inch are fine.
Use some reliable scales to measure your weight. Remove as much clothing as appropriate before weighing yourself.
BMI Calculator
Use our calculator to work out your Body Mass Index.
You can use metric or imperial measurements or a combination of the two.
Understanding BMI
It is important to remember that BMI is not always an accurate assessment of whether your weight is healthy. There are likely to be particular problems using it if:
You are aged between 2 and 18. The same method is used to calculate BMI in children and adolescents, but an extra step is required to gain a meaningful value. See BMI for children below.
You are pregnant.
You have a very athletic, muscular build. Muscle weighs more than fat and therefore athletes tend to record higher BMIs. In fact, many athletes find that their BMI suggests that they are overweight when this is actually not the case.
It is also important to remember that women generally have more body fat at the same BMI as men. Older people also tend to have more body fat (and less muscle) than younger people with the same BMI. There may even be health benefits for some over 70 year olds who fall into the ‘overweight’ range. Similarly, BMI does not work for all populations and ethnic groups. For example, many adults of South Asian origin may be at increased risk of diabetes when their BMI is just 23—normally considered well within the ‘healthy weight’ range.
If you are concerned, then speak to your doctor.
BMI Ranges
The following categories are used to determine adult body types based on BMI scores.
The World Health Organisation (WHO) defines a healthy adult BMI as being between 18.5 and 25. A BMI less than 18.5 indicates underweight (possibly caused by disease, malnutrition or eating disorders such as anorexia nervosa). A BMI over 25 suggests that you are overweight (possibly caused by poor diet choices or lack of exercise), and over 30 is defined as obese.
These ranges do not apply to children and adolescents aged between 2 and 18 years. See the section on BMI for children below.
| BMI | BMI Range |
| Less than 15 | Very severely underweight |
| Between 15 and 16 | Severely underweight |
| Between 16 and 18.5 | Underweight |
| Between 18.5 and 25 | Healthy weight |
| Between 25 and 30 | Overweight |
| Between 30 and 35 | Moderately obese |
| Between 35 and 40 | Severely obese |
| Over 40 | Very severely or morbidly obese |
If you are worried about your weight then you should seek professional help and advice.
BMI Chart
It can be useful to view BMI categories in a tabular form, especially to see your ideal weight range. The chart below shows BMI scores and categories for a range of the most common heights and weights.
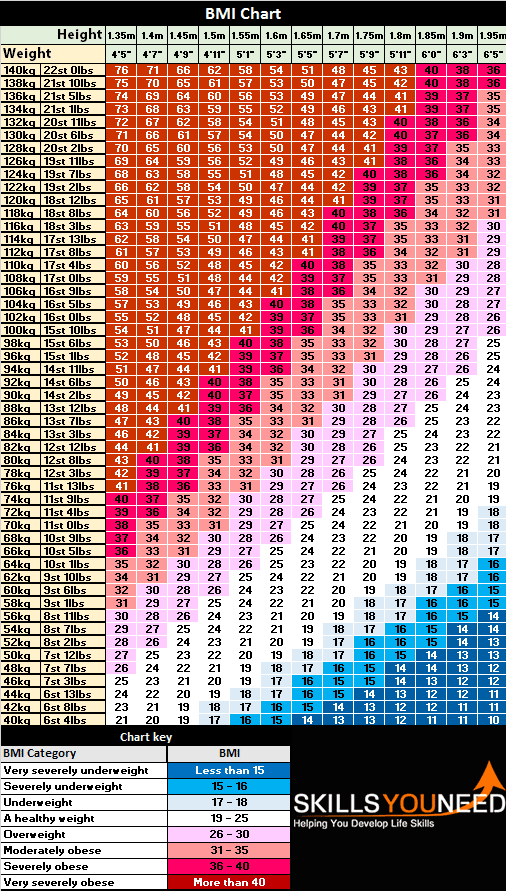
Need a bigger chart with more heights and weights? Download our free printable PDF - BMI Reference Sheet.
Body Mass Index for Children and Adolescents
Calculating the BMI for children and adolescents uses the same process as for adults. You can use our calculator or chart or work out BMI manually.
However, BMI for people aged between 2 and 18 years has a different meaning and therefore needs different interpretation.
As children grow, their ratio of body fat changes. Age is therefore taken into account to provide a more useful interpretation of a child’s BMI. Girls and boys also have different body fat ratios during development—and grow at different rates—and therefore the sex of the child is also important when measuring BMI.
For children and adolescents, BMI categories are based on age and sex within percentile ranges. Percentiles are used to determine a child’s BMI category based on data from other children of the same age and sex. A percentile is a measure representing the value below a given percentage of BMI in the data group. For example, the 5th percentile refers to the lowest 5%, and the 95th percentile refers to the lowest 95% (or top 5%) of BMI readings in the collected data.
BMI Categories for Children and Adolescents
| Child/Adolescent BMI Category |
Percentile Range |
| Underweight | Less than the 5th percentile. In the lowest 5% of the sample. |
| Healthy weight | Between the 5th and 85th percentiles. Not in the bottom 5% or top 15% of the sample. |
| Overweight | Between the 85th and 95th percentiles. Not in the bottom 85% or top 5% of the sample. |
| Obese | Above the 95th percentile. In the top 5% of the sample. |
Percentile Data
Compare your child’s BMI to the data provided below. Find their age along the bottom axis and their BMI along the vertical axis. Plot their calculated position on the chart.
If your child’s point falls below the blue line, they are less than the 5th percentile and may be underweight.
If your child’s point falls between the blue and black lines, they are a healthy weight.
If your child’s point falls between the black and red lines, your child is overweight or in danger of becoming overweight.
If your child’s point falls above the red line, they are above the 95th percentile and may be obese.
If you are worried about your child’s weight, then you should seek professional help and advice.
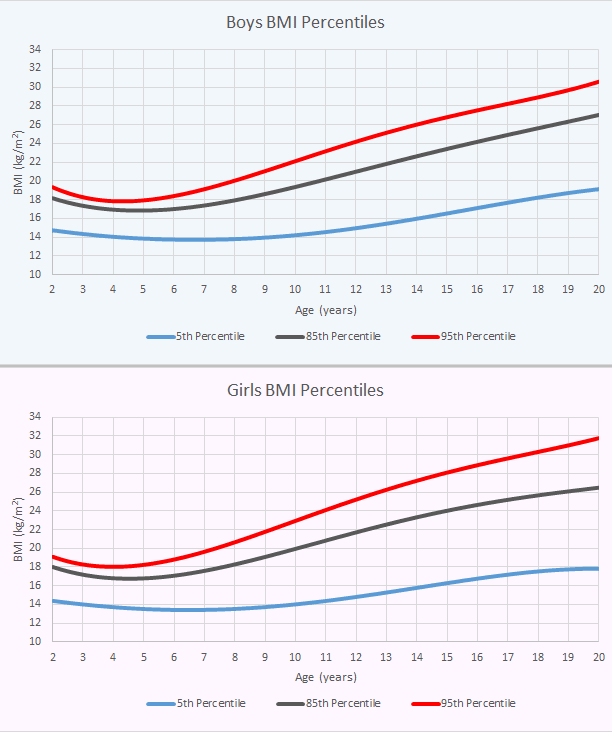
Percentile graphs based on Centers of Disease Control and Prevention original data.
Parents might also find our pages Feeding Babies and Feeding Toddlers helpful.
Manual BMI Calculation
If you require a very accurate BMI reading, or simply want to be able to calculate your BMI without the use of an online calculator or chart, then you can use the following formulas.
Using metric measurements (metres and kilograms)
BMI = weight ÷ (height2)
Example:
For this example we use a height of 1.85 metres and a weight of 92 kilograms.
- Work out your height squared – that is, multiply your height by itself.
Using our example height 1.85 × 1.85 = 3.42 (rounded to two decimal places). - Divide your weight by your height squared.
Using our example weight and height squared 92 ÷ 3.42 = 26.9.
In this example the BMI is 26.9.
Using US or imperial measurements (inches and pounds)
BMI = weight ÷ (height2) × 703.
Example
For this example we use a height of 72 inches (6ft) and a weight of 202 pounds (14st 6lbs).
- Work out your height squared – that is, multiply your height by itself.
Using our example height 72 × 72 = 5,184. - Divide your weight by your height squared and multiply the answer by 703.
Using our example weight and height squared 202 ÷ 5,184 × 703 = 27.4
In this example the BMI is 27.4
Want a quick BMI reference guide to use offline? Download our free and printable BMI Reference Sheet.
Continue to:
Dieting for Weight Loss
What is Fat?