
Real-World Maths
See also: Budgeting“Why do I need to know about maths at all?”
It’s a question that almost every parent has faced at some point, and one that many people have asked themselves too.
Basic numeracy skills and knowledge of maths is a vital part of everyday life.
This page gives some examples of where basic numeracy is a real help and can save hours of time, as well as money.
Sales Taxes
In many places, sales taxes are added to the basic purchase prices of both goods and services.
For example, in the UK, value-added tax (VAT) is added to various items. Prices may be shown with or without taxes included, either to make the price look lower, or because some buyers may be able to claim back the tax, and therefore need to know the tax-free cost.
If you want to work out what you will have to pay, you may therefore need to work out sales tax quickly, and you may not have a calculator app to hand. The tax is usually a percentage so, for more about calculating percentages, see our page on Percentages.
Your first step is to do your homework in advance and find out what the rate of sales tax on your planned purchase is in your location. For example, in the UK VAT on most goods is 20%, but only 5% on certain other items.
The sales tax system is more complicated in the US, and varies from state to state, but the information is readily available online.
There is a fairly simple trick that you can use for the calculation, which is to think of it in multiples of 10%.
Why? Because 10% of something is simply the number divided by 10 and dividing by 10 can be worked out by moving the decimal point one place to the left.
For VAT in the UK, then, 10% is half of 20%, and twice 5%. So that makes it easier to work out in your head. Here is an example:
What is the full price of something marked “£2.56 excl. VAT” where VAT is 20%?
You can work out 10% of £2.56 as £0.256, so 20% is twice that, which is £0.512.
£2.56 + £0.512 = £3.072 = £3.07.
Warning!
Never round until the very end, to avoid any rounding errors.
You can use the ‘10% rule’ even for quite complicated amounts like 17.5% (the old standard rate of VAT in the UK). 17.5% is 10% + 5% + 2.5%. We have shown how to work out 10% by moving the decimal point. We then add 5%, which is half of 10%, and then add 2.5%, which is half of 5%.
But what about if your tax is an awkward number, such as 11%? We can break this down into 10% + 1% (and we work out 1% in the same way as 10%, but by moving the decimal point two spaces to the left instead of one). However, you could also just decide that ‘around 10%’ is near enough for what you need.
Adding percentages quickly is also useful when leaving a tip for service, in a restaurant for example. If your bill was €54.40 and you wanted to leave a 15% tip then you can use the same process as described above. 10% of 54.40 is €5.44 and 5% is therefore half of €5.44, €2.72. The total tip is therefore 5.44 + 2.72 = €8.16. In reality you may decide to round this down to €8 or up to €10.
The other trick which is helpful is to round up the price to the nearest whole pound, euro or dollar. For example, if you round up a bill from $49.99 to $50, it’s much easier to work out any percentage.
Comparing Prices
Supermarkets are expected to provide information that will allow you to compare prices quickly and easily. However, you will probably have noticed that although the information is there, it’s still not that easy to compare prices.
Here are some of the different ways that supermarkets provide information that can make it harder:
Displaying information for two adjacent products in a different form, for example, one giving price per 100g and the other price per kg, or price per unit compared to price per weight.
Not displaying price per 100g under any offers, for example, 3 for 2, or ‘buy one get one free’.
Selling in certain units, but offering price comparisons in a different size, for example, yoghurts are often sold in 125g pots, but the price comparison will be per 100g. Cheese is often sold in 300g packets, but prices are per kg.
Providing offers with ‘funny numbers’ that make it harder to divide and see what you’re getting for your money. Examples of this include ‘3 for £2’.
Selling similar products in packs of different numbers of items or in different sizes, so that you can’t just compare the prices of the two packets. For example, supermarket own-brand cereal may come in a smaller box than a named brand, making a difference of a few pence in the price look much bigger.
It’s fair to say that most people won’t be opening up their their calculator app, to compare prices. After all, an offer’s always better value, isn’t it? But what about when you have two competing offers?
Using techniques like reducing fractions and estimating will help:
Reduce the price down to a ‘base unit’, either one of an item, or 100g.
Example:
125g is 5/4 of 100g. To put that another way, 100g is 4/5 of 125g.
To work out the relative costs of 100g, you can divide the cost of 125g by 5 and take that off the price. If something else is given as price per kg, just divide by 10 to get the price for 100g.
'Near enough' is usually good enough in price comparison terms, and probably a lot quicker than strict accuracy.
Example
You can see two offers: ‘5 for £2’ and ‘Two packs of six for £5’.
You want to know which is better value.
- First, work out what one unit will cost in each case.
- 5 units cost £2. In the ‘5 for £2’ offer, one unit therefore costs 200 ÷ 5 = 40p
- Two packs of six means 12 units. 12 units cost £5. You would therefore need to divide 500p by 12. However, you don’t have to do that, because ‘near enough is good enough’.
- Half of 12 is 6. Half of £5 is £2.50. Six units therefore cost £2.50.
- You can now compare this with five units for £2. You know the cost of the sixth unit, because that is the difference between the cost of six (£2.50) and the cost of five (£2), or 50p.
- You have already worked out that the first offer’s unit cost is 40p, so you know that the first offer (5 for £2) is better value.
Of course, if you need 12 then it may be better to buy the two six packs. You would have to buy £6 worth of the '5 for £2' offer to have enough.
‘Lies, Damned Lies, and Statistics’
Numbers carry a gravitas that mere words cannot hope to achieve. Advertisers often use statistics and numbers to try to convince us of their case.
Anything genuinely untrue is likely to lead to complaints to the regulators, for example, the Advertising Standards Authority in the UK. But the presentation of statistics can be an art-form in itself.
Newspapers are also often guilty of using ‘infographics’ which can be misleading.
Here are some of the top tricks to help you avoid getting caught out:
- Implied volume. One of the easiest tricks is to fool your eyes, and therefore your brain, by using a picture of something that has a volume. This can make you believe that the difference between two values is much bigger than it actually is, because your brain interprets the picture as having volume. If you look at our page on Volume, you will realise that it is a cubic measurement, and is therefore much bigger than simple surface area.
Suppose that you want to show a comparison between the amount of beer drunk in England and in Scotland. You decide to use a picture of a glass of beer. While the area of the two pictures may be in perfect proportion to the relative differences between the two quantities, your brain will interpret the larger one as being much larger, because your brain is seeing it as having volume, not just area.
- Where do the axes start and what are their relative scales? Beware of graph axes that either don’t start at zero, or have very small scales. They could well be trying to suggest that there are changes over time, when in fact, these changes are minimal.
Consider these two graphs:
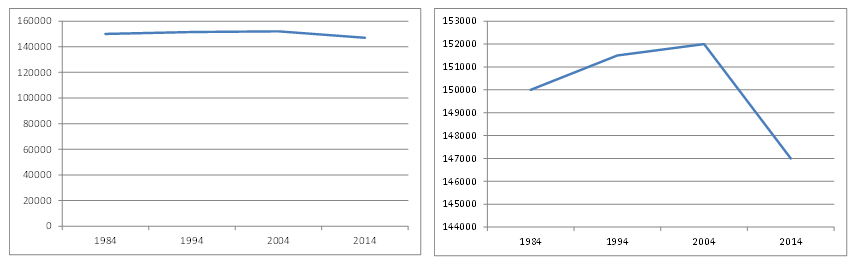
Both graphs show the same data, but with different y-axes (vertical) one starting at zero, and one not.
The first might be accompanied by a headline saying ‘Average house prices stable over time’, while the second could be alongside ‘House price slump’. You can decide which one you think is more accurate.
See our page: Graphs and Charts for more information on interpreting graphs.
Further Reading from Skills You Need
The Skills You Need Guide to Numeracy
This four-part guide takes you through the basics of numeracy from arithmetic to algebra, with stops in between at fractions, decimals, geometry and statistics.
Whether you want to brush up on your basics, or help your children with their learning, this is the book for you.
Conclusion
These are only a few examples of the times when a basic understanding of maths can help you avoid being caught out. There are many more.
Whether you want to compare prices in a supermarket, work out what you’re going to have to pay for a product or service, or just avoid being fooled by an eye-catching graph, a basic understanding of maths is vital.
Got some good examples you would like to share? Get in touch and let us know